
Understanding The Coffee Roasting Curve
For an untrained eye, the coffee roasting curve looks like a very confusing jumble of lines and data points. However, for coffee roasters, it is imperative to have the skill to interpret the roast curve so they can understand the coffee roasting process in greater detail. A coffee roasting curve is an important tool to help commercial coffee roasters fine-tune their roast profile, maximize the flavor notes from the coffee beans and maintain consistent quality in their cup. In this post, we will talk more about understanding the coffee roasting curve and how coffee roasting curve can help coffee roasters unlock the hidden potential of their specialty coffee beans.
Common Roast Data Used In Coffee Roasting
A coffee roaster needs to have the skill to interpret the coffee roasting graphs so they can improve their roasts, troubleshoot problems, and get a consistent result at every batch.
Coffee roasters collect and analyze a number of different roast data, such as:
- Bean Temperature
- Rate of Rise (RoR)
- Environmental Temperature
- Environmental Rate of Change
- Inlet Air Temperature
- Exhaust Temperature
- Development Time Ratio
On this blog, we will focus on understanding the Bean Temperature (BT) graph. We will discuss what the curve means, how it relates to what is actually happening inside the coffee roaster machine, and how this curve can help you make better decisions.
The Bean Temperature Curve
BT is arguably the most important coffee roasting curve, as it serves as an indicator of what goes on during the coffee roasting process, and it is used to track where exactly the coffee is along the roast cycle. The Y-axis represents the temperature scale, while the X-axis represents time.
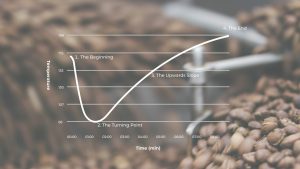
1. The beginning: a drop in the curve
At this stage, the probe is showing the charge temperature, which is the temperature inside the drum of the roaster machine before the coffee beans are added. Once the room-temperature coffee beans are dropped into the drum, heat energy is absorbed and cools the temperature probe down as represented by a steep drop in the graph. During this time, the coffee beans are actually heating up from their initial room temperature.
2. The turning point
As the green beans’ and the probe’s temperature find an equilibrium, the bean temperature reading will no longer drop and start to increase. This point in time shown at the bottom of the curve in the graph, which is marked as the turning point.
3. The upwards slope
The beans continue to increase in temperature at a variable rate, known as the Rate of Rise (RoR). The higher the RoR means that the increase of the beans’ temperature is also higher per unit of time, and reflected in a steeper slope. However, as the beans continue to heat up, they also lose moisture and weight, which means less heat is required in the roasting process. This is why the bean temperature graph gradually becomes less steep over time.
4. The end: the curve flattens
At this phase, the first crack happens which also marks the end of the browning stage and the start of the development stage of the coffee roasting process. In the graph, the curve shows a significant flattening or less pronounced upwards slope towards the end of the roast. The coffee roasting curve ends when the roasted coffee beans are removed from the roasting machine, and the graph marks the end temperature of the beans.
How To Use Coffee Roasting Curve To Stay Consistent
For coffee roasters, the main focus of the work is to maintain product consistency when roasting coffee, so customers can get the exact same flavors every time they buy another bag of the same coffee bean variety. By tracking a coffee roasting curve, professional roasters can easily chart and repeat a particular roast profile again and again. By observing the curve it is also possible to adapt and respond to any potential problems during the roast. Naturally, coffee roasters also need to use their senses (eyes, nose, ears) and spend considerable time and effort practicing in order to become efficient roasters in the long run.
Berto roaster machines are equipped with an automatic playback feature. From the smallest capacity Berto Essential up to the industrial size Berto Type R Roasters, all are designed to be highly responsive and capable of replicating roast profile. Linked with Artisan software which allows coffee roasters to save all the details of a roast, to be used as a standard reference profile for replicating the same quality in every batch. Explore more about our products or contact us if you need more information.
The coffee roasting curve and its marks can tell us if the coffee roasting process is going according to plan. Although other common roast data can also be useful and give us more insight into what is happening during the roast, starting with the BT curve can already guide us to understand the roast and make better decisions. Aside from this curve, coffee roasters also need to master the coffee roaster machine and its aspects, such as drum speed, heat transfer, and many more. By truly understanding what is going on inside the roaster machine, and by continuous effort for improvements, a coffee roaster can achieve the desired roast profile for a specific variety of coffee beans.
How Small Roasteries Can Manage Costs And Be More Profitable
Related Article
What Coffee Roasters Actually Do

Related Article
Understanding Heat Transfer Inside The Coffee Roaster Machine

Related Article